Power BI and number formats from SSAS Multidimensional

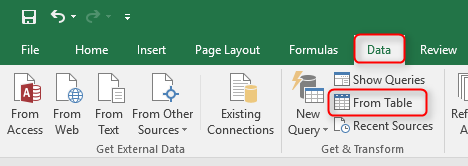
I had a rather odd experience this week. We are rolling Power BI out in the company I work for. We have a big investment in SSAS MD and that is not about to change. So I have been creating reports on top of SSAS MD for the last month or two with reasonable success. We are starting with a single cube and from the beginning number formatting was not recognized by Power BI. I assumed this was one of many things Power BI didn’t do well from SSAS MD so we tried to work our way around the problem. We used VBA functions in the cube script to limit measures to single decimal and we multiplied ratios by 100 to show percent. This was ok but not very good. Then we found a bad side effect with the VBA function which was that Excel pivot tables couldn’t recognize empty cells when using measures formatted with those functions. So I really starting looking into if Power BI couldn’t do number formatting from SSAS MD. It turns out that Power BI can do it but it just didn’t work for us. I tried few of our other cubes and while it didn’t work in the first couple cubes it did in some others.

I got a tip from Koen Verbeeck (twitter) about an article by Chris Webb (twitter) (article) explaining that while Power BI did recognize number formatting from SSAS MD if you changed the number format in a scope sentence Power BI wouldn’t recognize it any more. I read the article but couldn’t link that to our problem as we didn’t change any number format in scope sentences and not only some of our measures were missing number formatting, but all of them.

But the article got me thinking if our script could be the problem. We had quite few scope sentences in our script so I decided to start by deleting all scope sentences from the cube and see if Power BI recognized the number formatting then. And to my surprise it worked. I then decided to put them all in one by one to see where it went wrong. After some back and forth I managed to conclude that our time intelligence script (DateTool by SQLBI) and one other custom scope sentence (working on a dummy dimension) where to blame. Both these scripts were at the bottom of the script. What did the trick in the end was to take these two scripts and move them above the measures and all of a sudden Power BI recognizes the number formatting.

I now have the task of removing all the extra measures from the cube and change all the reports to use the normal measures instead of the special measures we had created to go around the problem.

If you are using Power BI on top of SSAS MD and don’t get the number formatting through. Take a hard look at your scope sentences and see if you need to either change them or move them around in your script.

SQL Saturday Iceland 2017 is over

Now it’s one week since SQL Saturday Iceland 2017 finished and I’m almost recovered. It was a blast like last year but I enjoyed this one a bit more as I feel we were better prepared and knew more what we were facing. Before last year I had only attended SQL Saturdays as a speaker and an attendee and even though you feel you can sense some of the work that goes into the preparations you still don’t know until you do it. But it’s not only work and worries organizing a SQL Saturday. There is a lot of fun, new friends and learning to be had from it if you put in the effort. The organizing team had great fun together, I met a lot of lot of speakers, some for the first time others again and this experience of organizing such a big event will help me in my future endeavors.

We had two pre-cons on the Friday which we had record attendees at. We also broke our record on the Saturday with just over 100 attendees. There was still 1/3 no shows so that’s something we need to work on. But I’m very pleased with how the event went. We had three tracks and the attendees were usually split nicely between those 3 tracks and everyone I met in the breaks were happy with what they saw and heard. We had 19 great speakers that took the journey to Iceland to speak and we are so appreciative of them. They are the key to this event being a success and their willingness to share their knowledge and time is so fantastic to such a small and isolated community as Iceland is. The venue was also great. All the equipment worked really well and the rooms were perfect for this size of an event. It didn’t hurt that you could see the snow falling in the un-spoilt nature through the big windows in the rooms.

We also had great sponsors. Some were there for the first time while other have been with us from the start. It is fantastic to see such great backing for the SQL community and we are very thankful that our sponsors made this event possible. I really hope they got something out of it as well as we want this to be a win-win for all included.

At last I just want to say thank you to the organizing team and other volunteers that worked hard both on the day but also during the weeks leading up to the event. I’m already looking forward to next year but before that I have some events to attend both as speaker and also as an attendee. More about that soon.

Email filters stopping .pbix files

I had a odd experience at work. While waiting for more Power BI licenses I decided to send couple of Power BI Desktop files in an email to few colleagues that didn’t have licenses yet. We are also experimenting with Microsoft Teams (another post coming about that soon) so the email was rather long with explanation about how to install Teams and Power BI desktop as well as description of the Power BI files. In the email I asked them to contact me if they needed any help. A week later I hadn’t gotten any feedback and started to wonder if nobody of them was trying it out. I then got a request for help from one the people that got the email. When I started to help them out it came into light that he hadn’t received the email at all. I try to resend it but while it looked like it had been sent on my end he didn’t receive anything. We had previously sent email with .pbix fiels in attachment without any problem. We called in help from a system administrator and he found out that the emails had been stopped by a rule that stopped emails with amongst other .js, attachments without any warning to either receiver or sender. As many of you might know the .pbix file is a compressed collection of files needed for to create a report. It turns out that Exchange opens up the collection and looks inside and if you have custom visuals in your report it will find a .js (JavaScript) file. You can look inside your .pbix file to see what is inside by copying it and then change the extension to .zip. You can then open the collection and look inside to see what files are in there.

So be aware that if you have Power BI Desktop report with custom visuals you might have problems where there is a JavaScript filter. If you send .pbix files in an email make sure that the receiver gets them as many companies have these kind of filters in place with good justification. You don’t want people sending malicious code in JavaScript format in email.

Hope this helps someone

Power Query / Power BI to the rescue

The company I work for recently bought a part of a company. Since we were not buying the whole company there were all kinds of complications. One of them was that the historical sales was delivered to us in Excel files as we didn’t get the ERP system. One of my tasks was to read the data into a staging database using SQL Server Integration Services. We got Excel files in many different formats as we got one from each sales region as well as the main company. One such file had a format that caused us some headache. The format was as below

Our procedure was to read the file into SQL Server and then manipulate it. But in this case there was a problem with the empty rows in the Customer and Product Group columns. First instinct was to use native Excel to fill in the blanks. This can easily be done by either copying and pasting or by double clicking on the corner of a cell to copy its content down. The problem with that is that the file was thousands of rows of data and as you can see in this small sample above there are huge amount of cells to fill down. Excel also has something called Flash Fill but that didn’t work as we wanted. The next thing that came to mind was to write some VBA code to do it. This is probably easy for a skilled and experienced VBA developer but there was no such available.

Then it came to me. Power Query / Power BI has a Fill transformation that fills either up or down in a column. So the problem was solved in 2 minutes. As I imagine this might be a common problem I decided to share my solution. My solution is done in Excel 2016 but the same applies for Excel 2013.

First I defined the data as a table by using Insert -> Table. Make sure a cell inside your table is selected and that My table has headers is checked


My data looked like below after I inserted the table.

Then I loaded the data into Power Query using Data -> From Table

Excel then opens the Power Query – Query Editor

As you can see it looks like my table with null where there are empty values. Here is where Power Queries magic comes in. One of many built in transformation is the Fill transformation. You can find it by either right clicking on the header of a column or by placing the focus on the column you want to transform and use the Transform menu were you click the small down arrow next to Fill.

By pressing the Down option on the Fill menu Power Query fills values down to the next value overwriting only nulls.

By repeating this for Product Group I get the following result which is exactly what I’m looking for.

Now I just need to load this into Excel again by using the Close & Load on the Home menu. This automatically writes the results into a new Excel sheet.

I love when there is a simple solution to a seemingly difficult problem and specially when I get to use something from my BI tool belt for something unexpected.

Ásgeir

My intentions for blogging in 2017

I’ve finally decided to start blogging. I have often thought about starting but never thought I had enough to say.

Having traveled around a lot last year speaking at various SQL Saturdays and other events I realized that I have things to share and there are people out there that would like to read stuff about BI.

So my intention for blogging in 2017 is at LEAST one blog a month. There might be more and they will be of different length and depth but I will at least put out one a month (and this doesn’t count).

Ásgeir