Author Archives: bidgeir

Power BI Governance

Power BI, like many other self-service BI tools, suffers for its dual purpose of being self-service but also used as an enterprise BI tool. Power BI started out as a pure self-service tool but has increasingly been moving to be more of an enterprise tool and can rightly be called a hybrid BI tool. No matter if you use Power BI as a self-service tool, as an enterprise BI tool or both, it’s important to include governance into your implementation. Far too many organizations start using Power BI without thinking about governance and then have the problem of trying to get their users to stop doing things as they are used to, and to start using process they are not used to and often feel will hinder their progress.

No matter if your organization is starting its Power BI journey or has already ventured in the Power BI “Wild West”, governance is an important and necessary part of any Power BI implementation.

This article will focus on the 4 pillars of a good governance strategy:

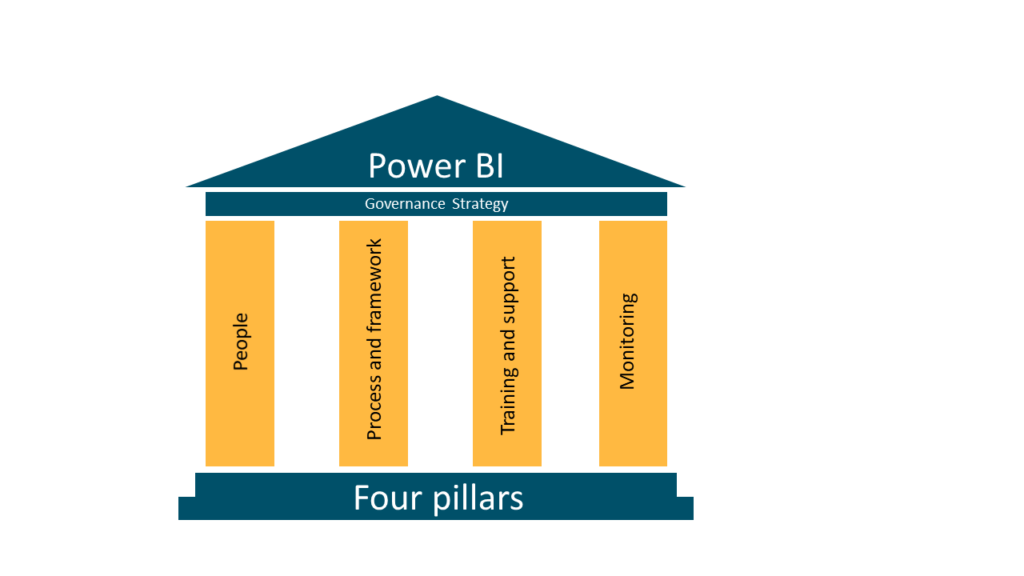
Figure 1: The Four Pillars of Power BI Governance Strategy

Process

At the heart of a governance plan are processes. There can be many smaller processes or few bigger ones but without them there is not much governance.

It´s important to have a formal governance process in place. This process is often broken down into smaller processes and usually contains processes for Development, Publishing, Sharing, Security, Naming standards, Support and Tenant Settings.

Most often these processes describe how to work with Power BI and sometimes they describe how to support Power BI. It´s vital that the processes are easily discoverable and are setup as a part of a whole so that users will know how each process ties into the whole governance strategy. One way is to have one master process document with links to all the process documents. Another way is to store all the process documents in the same library and categorize them so it´s easy to navigate between them and they are logically grouped.

We will look at the seven most common (in the our opinion) processes and see examples on what they might contain.

Development process

A development process most often describes how a report, datasets or both are developed. They describe where you develop the Power BI content and how you store and version your files.

Publishing Process

The publishing process usually describes how to set up multiple environments and how to promote Power BI content between them.

Sharing Process

The Sharing process describes how to share reports, dashboards and datasets and links to the security process for more details.

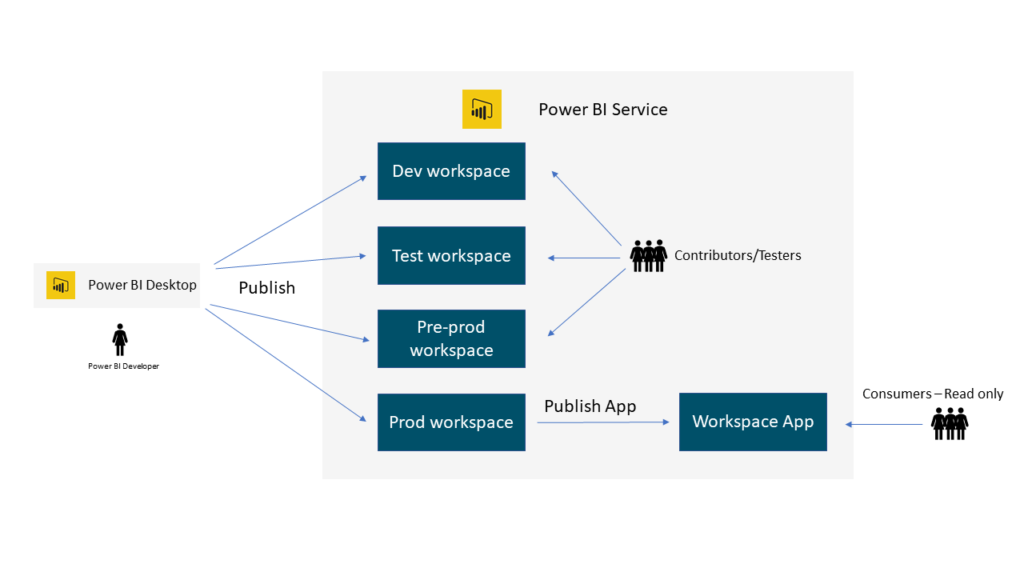
Figure 2: Example of a sharing process image

Security Process

A security process describes how to secure Power BI content. This is usually split into two categories: Object level security and data security.

Naming standard process

One of the most undervalued process is the Naming Standard process. Having this process early in the Power BI implementation will greatly improve the usability of the Power BI environment. Finding workspaces, reports, dashboards and datasets can be very tricky when you have hundreds of workspaces with no clear naming convention.

Support process

Many organizations neglect to create a proper support organization when implementing Power BI (see Roles section). Having a good support process will enable your current support organization or dedicated Power BI support people to more easily assist users when needed. A support process will help non-Power BI supporters to know when to dig in and try to solve a problem and when to refer the problem to the report owner or Power BI Support people.

Tenant Settings process

There are several settings in the Power BI admin portal that are important when it comes to governance. Publish to web, Sharing outside of organization, Export data, Internal support page to name few are all very important for different reasons. As there is no way to monitor the tenant settings automatically, it´s very important that the organization has a process in place defining how each setting in the Power BI Admin portal should be set, who the setting should apply to and describe why it´s important.

Training

If you want to have a successful Power BI implementation training is very important. You want to train everyone who touches Power BI but in a different way depending on their role. You want to make sure you get to everyone and deliver the right training based on their needs. It´s not only governance training that is important. Training users in properly using Power BI and using best practices will deliver value faster and will make report and dataset developers more compliant.

One of the things we have been exploring is to automate the training offer to users by using Microsoft Flow in combination with Office 365 (who has license) and the Power BI activity log (what are they doing). When a user gets a license or when they publish their first report or dataset they receive an email with the training being offered in the organization as well as relevant document and processes needed for their role.

Training categories

The most common training categories are Consumer, Report Developer and Report and Dataset Developer. For each category there is a definition of who belongs to it as well as what training content is appropriate and how it should be delivered. Most often the Consumer training is delivered either as videos or training manuals. Developer training is most often either classroom training or online training course.

Monitoring

One of the cornerstones of governance is monitoring. Monitoring what users are doing and monitoring what users are creating. From a governance perspective monitoring creation, access, usage, changes, deletion and data exports are the most important. Besides that, monitoring the settings of Power BI Admin Portal is very important.

The Power BI Rest API can tell you what artefacts exists and who has access to what. Besides that, the Rest API has powerful administration endpoints that allow you to get information about various administration objects as well as allow you to perform admin tasks. To access the Power BI Rest API, you can either create your own web application and call the API or you can use PowerShell to call it. Microsoft has put some effort into wrapping many of the endpoint in the API into PowerShell cmdlets and they have also created a cmdlet to wrap the call to the Rest API. You can read more about the PowerShell cmdlets at https://docs.microsoft.com/en-us/powershell/power-bi/overview?view=powerbi-ps and you can read more about the Power BI Rest API at https://docs.microsoft.com/en-us/rest/api/power-bi/. The user will have access to some of the endpoints through normal Power BI workspace access, but a lot of the endpoints require the user to be a Power BI administrator, at least if they want tenant level information.

Monitoring usage

The Power BI Activity log can tell you who accessed what and who changed or deleted what. The Power BI activity log is turned off by default but can be turned on in the Power BI Admin Portal. The activity log can be accessed in two places:

Power BI Rest API

The last 30 days of the activity log is now replicated from the Office 365 Security and Compliance to the Power BI admin portal and you can get to that with the Power BI Rest API if you are a Power BI admin.

In the Office 365 Security and Compliance

The activity log is part of the Office 365 Security and Compliance Centre. To get access to the activity log in the Office 365 Security and Compliance Centre you need to have the View-Only Audit Logs or Audit Logs role in Exchange Online or be an Office 365 admin. It is possible to fetch data from the Office 365 acitvity log in two ways. One is to log into the Office 365 Security and Compliance Centre, run the log query and either view the results on the screen or download the results as a CSV file. Another way is to use the Office 365 Rest API which is the preferred way if you want the automate the collection of the log information. Note that the log is only stored in the Office 365 Security and Compliance Centre for 90 days so if you want to keep it for a longer time you will need to collect it and store it in a different place such as data warehouse. More information about the acitivty log and how to collect the data can be found here: https://docs.microsoft.com/en-us/power-bi/service-admin-auditing.

We recommend that both the activity log and artefact inventory is collected and stored in a database. Partly because of governance issues as described before but partly because there is valuable information in there about adoption, development over time and user behavior which could be beneficial for the organization at a later time.

A close up of a logo

Description generated with very high confidence

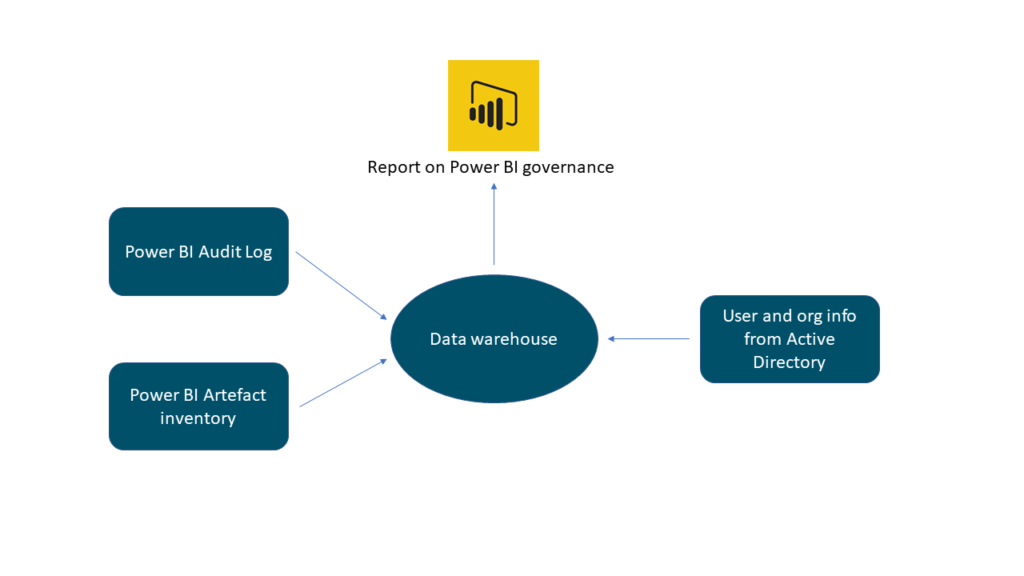
Figure 3: Monitoring Power BI strategy

Monitoring Power BI Admin Portal

There are several settings in the Power BI Admin Portal that are very important when it comes to governance. One of the main points of interest is the Tenant settings. Some of the settings that you can change in the Tenant settings part of the portal are who can publish to web, who can share externally, who can create workspaces and where the internal help portal is. There are in all 31 settings you can change. Some of them are fine in the default settings while others like Publish to web should be changed as soon as possible.

Besides the Tenant Settings some of the other things you can change are Capacity Settings, Dataflow Settings, look at all workspaces in the tenant, turn on audit logs and brand the Power BI portal.

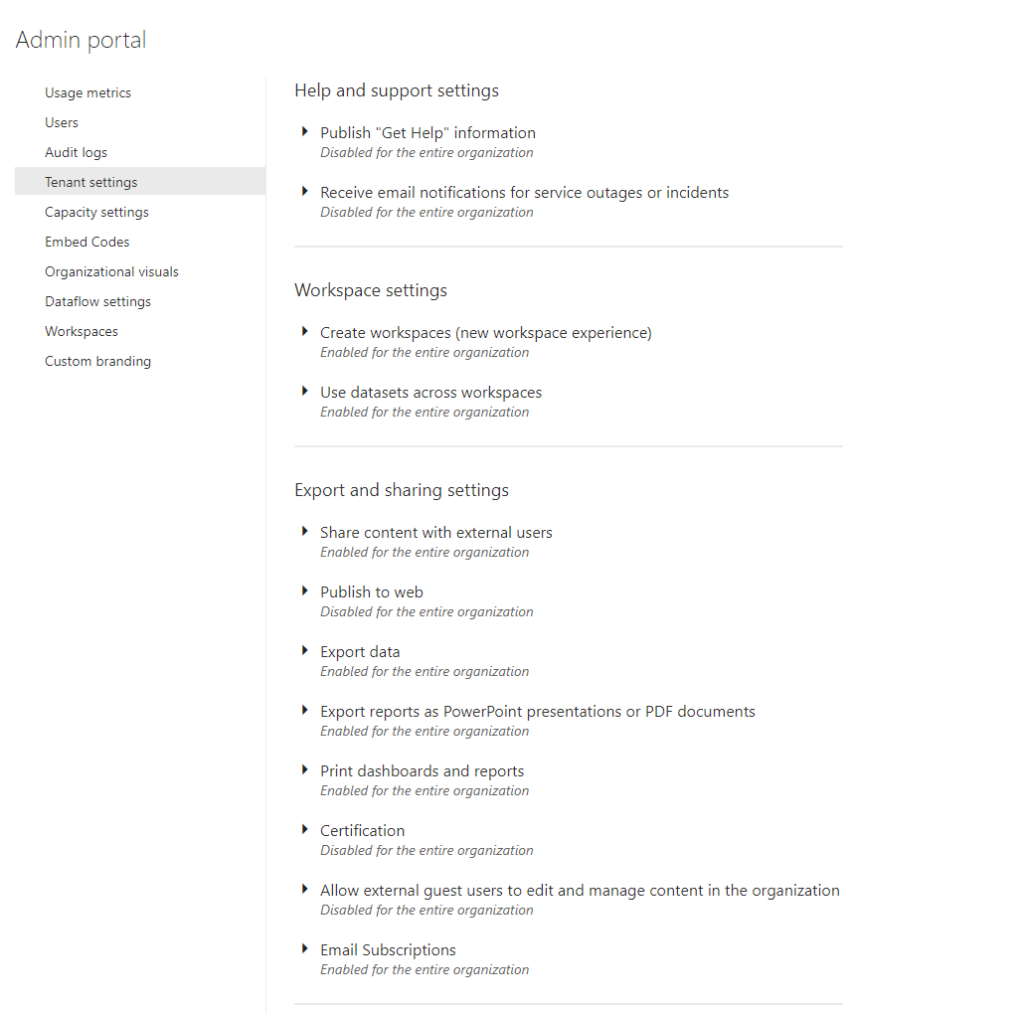
Figure 4: Power BI Admin Portal

It´s very important that the Tenant settings are documented and monitored regularly. Unfortunately, you cannot monitor these settings automatically, so someone needs to login to the portal and manually check the settings. We recommend that you write down all the settings and have the admin check them once a month. This is especially important if you have more than one administrator. The main reason for that is that any change made in the portal is not logged anywhere you can access. If you have not written down how you want the settings to be it´s very difficult for an admin to know if the settings are correct as they cannot see if they have been changed unless they remember the previous setting.

Besides the Tenant settings we recommend that you turn on Audit logs which are needed for activity monitoring and review Embed codes to make sure there is no sensitive data being embedded outside of an approved system. If you have Power BI Premium you can also use the Capacity settings to control your capacities.

At the time of this writing there are 91 events that are monitored in the Power BI audit log. If your organization does not want to store all that data you should consider taking all events that are about viewing, editing (including deleting) and exporting. When you have started the collection of the data you might want to join it to further information from the artefact inventory discussed in the previous section as well as information about the organization employees and the organization structure.

Monitoring the Power BI On-Premise Gateway

The Power BI On-Premise Gateway is a Windows service running on an on-premise server. The gateway needs to be monitored as other Windows services. The main things to monitor are the service uptime and server performance. Normally monitoring is in the hands of an infrastructure team (if one exists).

Roles

To be successful with a Power BI implantation in the long run it´s important to have well defined roles. This is most likely different from organization to organization and in some cases the same person might have more than one role. The most common roles are Power BI Administrator, Power BI Gateway Administrator, Data steward, Power BI Auditor and Power BI Supporter(s).

Automation

For the training and processes you can automate the discoverability by sending content to users as soon as they get a license or as soon as they create content. That way you are sure that all your users are aware of the processes and training and you can control what they receive depending on where they are in their Power BI journey.

Summary

This article suggest that a good Power BI governance strategy has 4 pillars, Processes, Training, Monitoring and Roles. Organizations need to define processes so that their users do Power BI right, train them to follow the processes as well as best practices when it comes to Power BI, Monitor the Power BI environment and have defined roles and responsibilities. Each pillar has equal importance and for a successful Power BI implantation you want to make sure you think about them all.

Governance is a necessary part of a Power BI implementation and the earlier you can start the easier it will be.

If you want to discuss Power BI governance or get help with implementing it in your organization please contact Ásgeir Gunnarson on asgeir@northinsights.com or go to http://northinsights.com and fill out the contact form. We offer consulting, training and advisory on the whole Business Intelligence lifecycle including Power BI.

Written by:

Ásgeir Gunnarsson

Microsoft Data Platform MVP

Using Power BI tooltip pages for glossary information

We have been considering many options when it comes to how we can incorporate glossary information into our Power BI reports. We have started the work of creating master data around our glossary and are considering how best to get it into our cubes.

When Microsoft announced the tooltip pages for Power BI I saw that this could be the way we display the glossary in our reports. So, while we solve the problem of getting the glossary into the cubes I decided to try to add the glossary manually to a tooltip page to see how it looks.

Traditionally we have been showing support measures in the tooltip. An example of this is when Net Sales Growth is in a graph the tooltip would show Net Sales and Net Sales Growth %. I really like how you can for most visuals put in multiple tooltip measures, but my problem has been that everything in the visual is displaying in the tooltip. For an example we sometimes include a measure only meant to colour the graph. This can be a Net Sales vs. EBTIDA measure or something like that. This measure is not meant for displaying in the graph but because you don‘t have any control over the tooltip it is displayed.

With the tooltip page you have full control over what you display and what you don‘t and you get more space to work with. In the images below, you see that when looking at Gross Profit Growth in a graph we were displaying the Gross Profit and Gross Profit Growth and are using Gross Profit Growth % vs Net Sales Growth % to colour the graph. This is nice enough but the extra colouring measure is annoying and you are, in my mind, missing the definition of Gross Profit.

Below you see an image of how we are now doing using the new tooltip pages. Here we are showing prior year Gross Profit, current period Gross Profit, the Gross Profit Growth % and the definition of Gross Profit. Now many of you might feel the definition is not important but when you work in a multinational company the definitions often become important. While the definition of Gross Profit is simple the definition of measures such as Cost of goods sold (COGS) can be complicated and so it‘s is important that everybody knows exactly what definition is used.

This is of course just the start and I see plenty of opportunity to relay more messages to the users via the tooltip page. This can be definitions of calculations where appropriate or dimension definitions.

Power BI and number formats from SSAS Multidimensional

I had a rather odd experience this week. We are rolling Power BI out in the company I work for. We have a big investment in SSAS MD and that is not about to change. So I have been creating reports on top of SSAS MD for the last month or two with reasonable success. We are starting with a single cube and from the beginning number formatting was not recognized by Power BI. I assumed this was one of many things Power BI didn’t do well from SSAS MD so we tried to work our way around the problem. We used VBA functions in the cube script to limit measures to single decimal and we multiplied ratios by 100 to show percent. This was ok but not very good. Then we found a bad side effect with the VBA function which was that Excel pivot tables couldn’t recognize empty cells when using measures formatted with those functions. So I really starting looking into if Power BI couldn’t do number formatting from SSAS MD. It turns out that Power BI can do it but it just didn’t work for us. I tried few of our other cubes and while it didn’t work in the first couple cubes it did in some others.

I got a tip from Koen Verbeeck (twitter) about an article by Chris Webb (twitter) (article) explaining that while Power BI did recognize number formatting from SSAS MD if you changed the number format in a scope sentence Power BI wouldn’t recognize it any more. I read the article but couldn’t link that to our problem as we didn’t change any number format in scope sentences and not only some of our measures were missing number formatting, but all of them.

But the article got me thinking if our script could be the problem. We had quite few scope sentences in our script so I decided to start by deleting all scope sentences from the cube and see if Power BI recognized the number formatting then. And to my surprise it worked. I then decided to put them all in one by one to see where it went wrong. After some back and forth I managed to conclude that our time intelligence script (DateTool by SQLBI) and one other custom scope sentence (working on a dummy dimension) where to blame. Both these scripts were at the bottom of the script. What did the trick in the end was to take these two scripts and move them above the measures and all of a sudden Power BI recognizes the number formatting.

I now have the task of removing all the extra measures from the cube and change all the reports to use the normal measures instead of the special measures we had created to go around the problem.

If you are using Power BI on top of SSAS MD and don’t get the number formatting through. Take a hard look at your scope sentences and see if you need to either change them or move them around in your script.

SQL Saturday Iceland 2017 is over

Now it’s one week since SQL Saturday Iceland 2017 finished and I’m almost recovered. It was a blast like last year but I enjoyed this one a bit more as I feel we were better prepared and knew more what we were facing. Before last year I had only attended SQL Saturdays as a speaker and an attendee and even though you feel you can sense some of the work that goes into the preparations you still don’t know until you do it. But it’s not only work and worries organizing a SQL Saturday. There is a lot of fun, new friends and learning to be had from it if you put in the effort. The organizing team had great fun together, I met a lot of lot of speakers, some for the first time others again and this experience of organizing such a big event will help me in my future endeavors.

We had two pre-cons on the Friday which we had record attendees at. We also broke our record on the Saturday with just over 100 attendees. There was still 1/3 no shows so that’s something we need to work on. But I’m very pleased with how the event went. We had three tracks and the attendees were usually split nicely between those 3 tracks and everyone I met in the breaks were happy with what they saw and heard. We had 19 great speakers that took the journey to Iceland to speak and we are so appreciative of them. They are the key to this event being a success and their willingness to share their knowledge and time is so fantastic to such a small and isolated community as Iceland is. The venue was also great. All the equipment worked really well and the rooms were perfect for this size of an event. It didn’t hurt that you could see the snow falling in the un-spoilt nature through the big windows in the rooms.

We also had great sponsors. Some were there for the first time while other have been with us from the start. It is fantastic to see such great backing for the SQL community and we are very thankful that our sponsors made this event possible. I really hope they got something out of it as well as we want this to be a win-win for all included.

At last I just want to say thank you to the organizing team and other volunteers that worked hard both on the day but also during the weeks leading up to the event. I’m already looking forward to next year but before that I have some events to attend both as speaker and also as an attendee. More about that soon.

Email filters stopping .pbix files

I had a odd experience at work. While waiting for more Power BI licenses I decided to send couple of Power BI Desktop files in an email to few colleagues that didn’t have licenses yet. We are also experimenting with Microsoft Teams (another post coming about that soon) so the email was rather long with explanation about how to install Teams and Power BI desktop as well as description of the Power BI files. In the email I asked them to contact me if they needed any help. A week later I hadn’t gotten any feedback and started to wonder if nobody of them was trying it out. I then got a request for help from one the people that got the email. When I started to help them out it came into light that he hadn’t received the email at all. I try to resend it but while it looked like it had been sent on my end he didn’t receive anything. We had previously sent email with .pbix fiels in attachment without any problem. We called in help from a system administrator and he found out that the emails had been stopped by a rule that stopped emails with amongst other .js, attachments without any warning to either receiver or sender. As many of you might know the .pbix file is a compressed collection of files needed for to create a report. It turns out that Exchange opens up the collection and looks inside and if you have custom visuals in your report it will find a .js (JavaScript) file. You can look inside your .pbix file to see what is inside by copying it and then change the extension to .zip. You can then open the collection and look inside to see what files are in there.

So be aware that if you have Power BI Desktop report with custom visuals you might have problems where there is a JavaScript filter. If you send .pbix files in an email make sure that the receiver gets them as many companies have these kind of filters in place with good justification. You don’t want people sending malicious code in JavaScript format in email.

Hope this helps someone

Power Query / Power BI to the rescue

The company I work for recently bought a part of a company. Since we were not buying the whole company there were all kinds of complications. One of them was that the historical sales was delivered to us in Excel files as we didn’t get the ERP system. One of my tasks was to read the data into a staging database using SQL Server Integration Services. We got Excel files in many different formats as we got one from each sales region as well as the main company. One such file had a format that caused us some headache. The format was as below

Our procedure was to read the file into SQL Server and then manipulate it. But in this case there was a problem with the empty rows in the Customer and Product Group columns. First instinct was to use native Excel to fill in the blanks. This can easily be done by either copying and pasting or by double clicking on the corner of a cell to copy its content down. The problem with that is that the file was thousands of rows of data and as you can see in this small sample above there are huge amount of cells to fill down. Excel also has something called Flash Fill but that didn’t work as we wanted. The next thing that came to mind was to write some VBA code to do it. This is probably easy for a skilled and experienced VBA developer but there was no such available.

Then it came to me. Power Query / Power BI has a Fill transformation that fills either up or down in a column. So the problem was solved in 2 minutes. As I imagine this might be a common problem I decided to share my solution. My solution is done in Excel 2016 but the same applies for Excel 2013.

First I defined the data as a table by using Insert -> Table. Make sure a cell inside your table is selected and that My table has headers is checked


My data looked like below after I inserted the table.

Then I loaded the data into Power Query using Data -> From Table

Excel then opens the Power Query – Query Editor

As you can see it looks like my table with null where there are empty values. Here is where Power Queries magic comes in. One of many built in transformation is the Fill transformation. You can find it by either right clicking on the header of a column or by placing the focus on the column you want to transform and use the Transform menu were you click the small down arrow next to Fill.

By pressing the Down option on the Fill menu Power Query fills values down to the next value overwriting only nulls.

By repeating this for Product Group I get the following result which is exactly what I’m looking for.

Now I just need to load this into Excel again by using the Close & Load on the Home menu. This automatically writes the results into a new Excel sheet.

I love when there is a simple solution to a seemingly difficult problem and specially when I get to use something from my BI tool belt for something unexpected.

Ásgeir

My intentions for blogging in 2017

I’ve finally decided to start blogging. I have often thought about starting but never thought I had enough to say.

Having traveled around a lot last year speaking at various SQL Saturdays and other events I realized that I have things to share and there are people out there that would like to read stuff about BI.

So my intention for blogging in 2017 is at LEAST one blog a month. There might be more and they will be of different length and depth but I will at least put out one a month (and this doesn’t count).

Ásgeir